How IIJA Lead Replacement Funding Is Moving: New State Profiles from EPIC
By Ekta Patel and Janet Pritchard
The 2021 Infrastructure Investment and Jobs Act (IIJA) made $15 billion available nationally for lead service line replacement (LSLR) through state Drinking Water State Revolving Fund (DWSRF) programs. These funds are a critical resource for communities in meeting the federal requirement to replace all lead service lines by 2037. As this historic investment flows to states, it raises the question: Is this money moving quickly and at scale into priority projects on the ground?
Over the past year, EPIC's DWSRF Funding Tracker has analyzed Intended Use Plans (IUPs) from 15 states, including Texas, New York, Tennessee, Alabama, Louisiana, Wisconsin, Indiana, Illinois, Michigan, Ohio, New Jersey, Pennsylvania, Mississippi, Minnesota, and Arkansas. What we’ve seen is substantial variation in how states structure their programs, prioritize projects, and report progress. IUPs tell us what states plan to fund. They don’t tell us what actually happens next.
That gap is where projects stall—and where communities feel it.
What Happens After States “Plan” to Support Projects?
To answer that question, EPIC will be releasing a set of IIJA LSLR Funding Profiles. These profiles follow lead projects beyond planning documents to see whether—and how fast—they move from priority lists to executed financing agreements.
Starting with New York and followed soon by Texas, Michigan, Tennessee, and Alabama, the profiles track what happens after projects are listed in IUPs by examining executed SRF Assistance Agreements reported through the EPA SRF Portal and state annual reports.
Each profile looks at four core questions:
Are funds being disbursed? What share of federal dollars has reached executed agreements?
How strong is the project pipeline? How long do projects spend on Comprehensive and Fundable lists before advancing?
Are states making strategic use of set-asides? Are states taking advantage of allowable set-asides for technical assistance, affordability, and program support?
Who’s getting funds? Are state-defined disadvantaged communities (DACs) represented in executed agreements?
Following Projects Across Multiple Years
One of the most revealing parts of this work is tracking individual lead projects across consecutive IUPs and matching them to executed agreements. This approach reveals patterns that single-year snapshots miss, like how long projects spend on lists before advancing—or whether they advance at all.
In New York, we linked lead projects across four state fiscal years (SFY 2023-2026).

Figure 1: Persistence of Lead Projects on New York’s Comprehensive Lists Across Multiple Years (SFYs 2023-2026)
Figure 1 shows how long projects remain on the Comprehensive Lists, which include early-stage projects still working through planning and readiness requirements. Nearly all SFY23 projects (99%) appeared again in SFY24, 89% persisted into SFY25, and roughly 64% were still listed in SFY26. Some carryover is expected, but this level of persistence suggests deeper barriers such as fiscal constraints, limited technical assistance, administrative capacity gaps, or readiness requirements that communities struggle to meet.
This pattern continues even after projects advance.
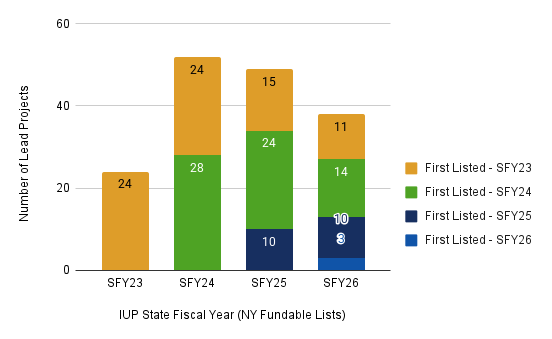
Figure 2: Persistence of Lead Projects on New York’s Fundable Lists Across Multiple Years (SFYs 2023-2026)
Figure 2 tracks projects on New York’s Fundable Lists, which include projects that passed initial prioritization. Even here, advancement to executed agreements took time. All SFY23 Fundable projects reappeared in SFY24, 63% remained in SFY25, and 46% were still listed in SFY26. Among the 24 projects that received IIJA LSLR funding through November 2025, the average time from first appearing on a Fundable List to reaching an executed agreement was two years.
This points to capacity and implementation challenges—not a lack of local need.
What the New York Profile Shows
New York is EPIC’s first completed state profile, and the findings are telling.
The state has received $369 million in IIJA LSLR funding through FFY24, about 10% of the estimated need to replace roughly 383,000 lead service lines.
Demand for LSLR funding more than doubled, from $343 million in SFY23 to $857 million in SFY26.
Despite that demand, New York used only 10% of allowable set-asides in SFYs 2023-2024 and 0% in SFYs 2025-2026, leaving approximately $107 million in unused set-aside capacity over four years.
As of November 2025, only 24 SRF Assistance Agreements, totaling $59.5 million (just 16.1% of received funds) had been executed.
Of those 24, 22 funded inventory activities, while only two supported replacement.
Inventories are necessary. But funding them primarily through project grants instead of set-asides consumes subsidy dollars that could otherwise support replacement. Using set-asides more strategically would preserve grant funding for construction and reduce costs for communities.
Where Programs Can Move Faster
The New York profile highlights several concrete opportunities:
Shift inventory and other non-construction activities to set-asides to preserve additional subsidies for replacement projects.
Use remaining set-aside capacity for technical assistance and program support.
Offer planning loans or early support to help projects meet readiness requirements.
Refine prioritization criteria to accelerate replacement projects.
Improve transparency around executed agreements so progress is visible.
None of these requires new federal authority. They require better use of the tools states already have.
More States Coming Soon
Profiles for Texas, Michigan, Tennessee, and Alabama are in development. Together, they will enable cross-state comparisons of how IIJA LSLR programs are structured and how effectively they deliver.
These profiles are designed for state administrators benchmarking program performance, advocates tracking fund deployment, and policymakers evaluating whether current approaches will help meet 2037 goals. Most importantly, they provide the multi-year evidence needed to distinguish slow projects from slow systems—and to help fix the systems.
Want updates as new profiles are released? Sign up below to receive notifications and access ongoing analysis from EPIC’s DWSRF Funding Tracker.
DWSRF Funding Tracker
EPIC’s Drinking Water State Revolving Fund (DWSRF) Funding Tracker provides data and policy analysis, increases program transparency, and makes state policy decisions—and their impacts—more accessible to the public.