Expanding our Understanding of Wetlands: Nation-wide Updates to the Wetlands Impact Tracker
It all started nearly three years ago as an offhanded comment from a watershed advocate to a data scientist:
“Wouldn’t it be nice if I didn’t need to read all these Army Corps PDFs?” said the advocate.
“Yeah it would be! There’s a lot of data in these PDFs - let’s see what we can do” responded the data scientist.

While the conversation was a bit more verbose, the core concept was there: extract key information from the U.S. Army Corps of Engineers (USACE) notices about projects with probable impacts to Waters of the United States, under Section 404 of the Clean Water Act, and see what is being proposed to be built into an easily searchable database and map. In collaboration with Atlas Public Policy, we released Version 1 for the Gulf of Mexico in January 2024, we have now expanded nationally..
The Tracker was first designed to provide Healthy Gulf and similar organizations the data they need to organize, analyze, and understand proposed impacts to their communities. The technical work solved for two key problems:
From the date of publication, the public typically has thirty days to leave a comment or request a hearing - a short time window to evaluate, prepare, and submit. The amount of time it would take to 1) find this information from Army Corps websites and 2) read through the extensive PDFs was so cumbersome, it made it very difficult for the public to participate in the process.
These PDFs contain invaluable data on project details like impact acreage, at-risk endangered species, and if mitigation will be necessary to offset impacts. Squirreling that information in a PDF means that it is not easily cross-referenced with other environmental data or used in future environmental decisions.
We created an efficient and intuitive way to automatically pull the data out of the PDFs on a daily basis for advocates, policymakers and agencies alike to easily view data on the proposed projects, and also leverage this information for watershed or regional analysis.
Our focus for the first iteration was to prove the concept and provide immediate value for our advocate partners in the Gulf of Mexico, largely addressing petrochemical developments. That said, our database includes all projects being proposed from dredging activity in navigable waters to the filling of wetlands for suburban or industrial developments, and restoration projects. We focused on four states (Texas, Louisiana, Mississippi, and Florida) and their corresponding USACE districts. For our update, our requirements were threefold:
Expand the geographic scope to other regions
Display finalized permit data, when and where available
Make the tool more usable and accessible
With our goals identified, we set forth on development over the Spring and Summer of 2025. During the process, we engaged over thirty experts through usability sessions and surveys. Data and insights collected during these sessions helped us understand how the notice data was useful across various domains. The resulting updates reflect our intentionally iterative feedback loops, growing expertise, and audience input - dramatically improving the usability of the tool.
What’s New as of September 2025
Updated data scraping methods for increased accuracy
Expansion to over 45 states and territories and 28 USACE districts (and growing every day!)
Inclusion of FOIAd finalized permit data, matched to notices when and where available. (e.g. you can track a project from the first notice to the completed permit!)
Cumulative impacts analysis.
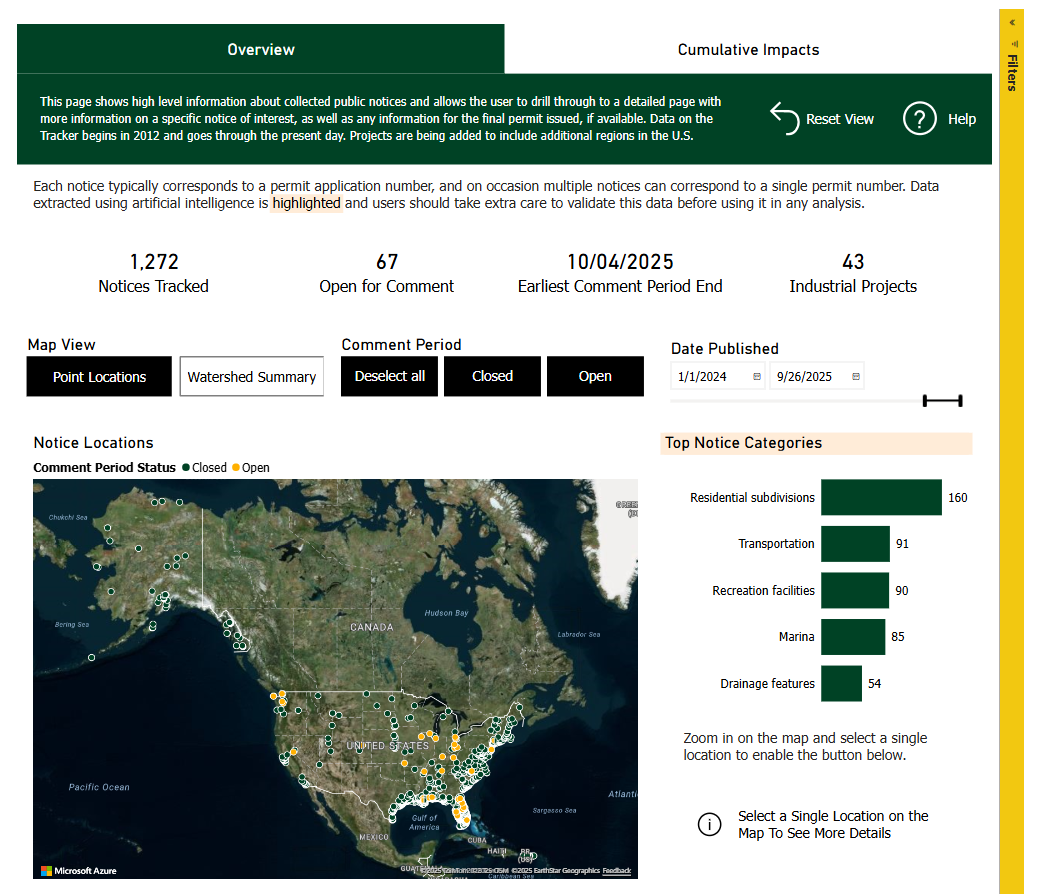
Updated interface with improved visual display and mapping.
A Glimpse at What’s Possible
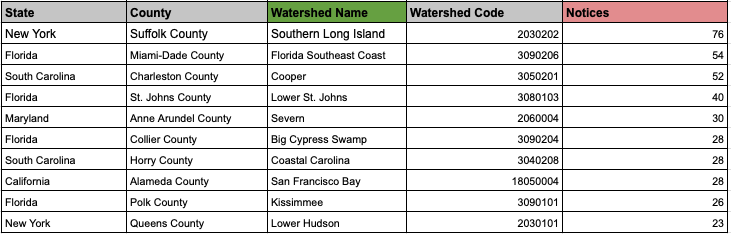
With this data, we can understand what types of projects are being proposed, but also what watersheds across the country are currently seeing the most activity, an analysis known as cumulative impacts. Tallying the count of notices across watersheds allows us to see that work is not spread evenly across locals, rather clustered in certain areas.
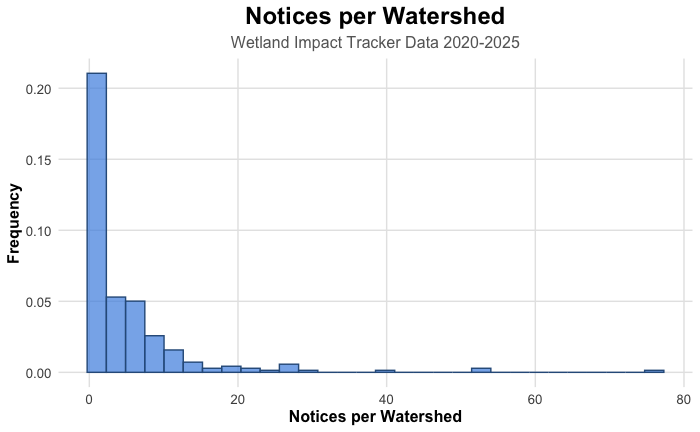
Filtering from the time range 2020-2025, the data shows concentrations of development along the eastern seaboard, with 9 of the top 10 watersheds draining to the Atlantic. At the top of the list is Southern Long Island, with 76 notices over the past five years.
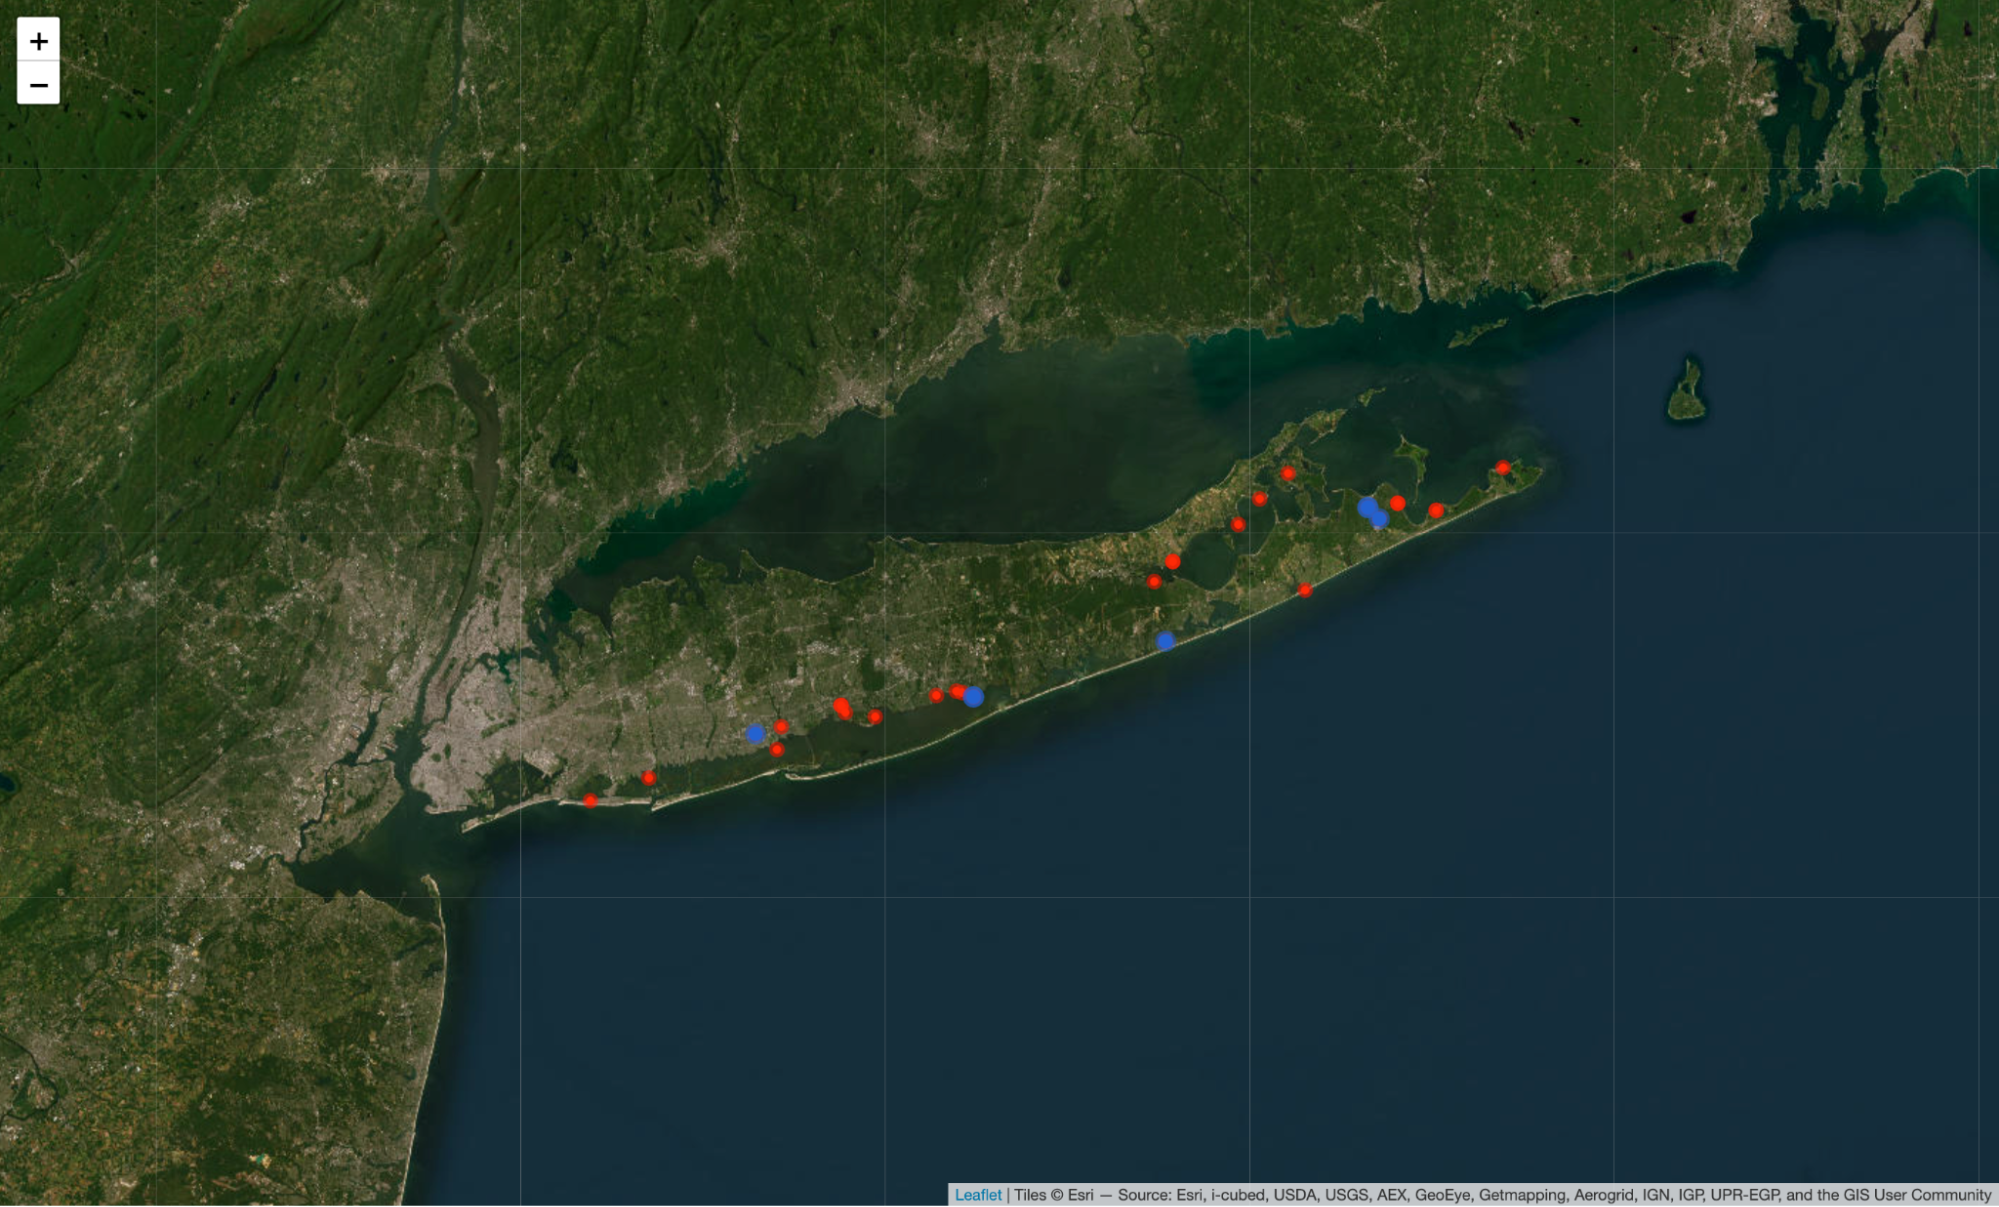
The data doesn’t stop there, we can utilize the project details data to see what are impacts (shown in red), and what are mitigation or conservation activities (shown in blue). From here, you can link-out directly to the notice pdfs, read a quick summary, or tally the proposed acreage impacts.
We are still combing through the notice data, alongside finalized permit data to understand the patterns of development within and across regions. We welcome the use of the Tracker, and the underlying data [link to github/data resource] to generate these types of insights.
Our hope is that with this data, we can better defend our coastal communities and ecological resources through sustainable development and robust conservation. We’re also strategizing on ways to make the data more easily accessible in the first place so there doesn’t have to be so much data wrangling! Imagine if the notices were published in this format in the first place rather than PDFs!
If you’d like to learn more, please check out:
Project announcement blog for additional policy background
Release webinar for tool demo
Looking for other work like this? Follow our permitting technology work
Reach out gabe@policyinnovation.org!