An Initial Analysis of EPA’s New State Funding Allotment for Lead Service Line Replacement
The EPA made an important announcement on April 4, 2023, headlining the allocation of $6.5 billion of federal funding for state water infrastructure improvements, including funds from the Infrastructure Investment and Jobs Act (IIJA). As a result of this announcement, some states will get significantly more funding for lead service line replacement over the coming years.
EPIC shared our response to the April 4th announcement in an initial reaction and a blog discussing the implications of the allotment formula adjustment on replacing lead service lines across the country. Since then, environmental advocates have questioned the survey results, and also submitted Freedom of Information Act (FOIA) requests for the results in an attempt to obtain more information.
The following represents EPIC’s initial analysis and takeaways on the importance of these changes, which we still continue to analyze:
The allotment of federal funding for lead service line replacement is being revised to align funding with states’ “lead burden,” which is good - but the survey responses appear to be an imperfect indicator for aligning funding.
The Safe Drinking Water Act requires EPA to undertake a needs survey every four years called the Drinking Water Infrastructure Needs Survey and Assessment (DWINSA) and to use the information gathered to determine how federal funding for Drinking Water State Revolving Funds (DWSRFs) is allocated to states. Allocation of the $6.5 billion to states announced on April 4th was based on a newly compiled survey of drinking water infrastructure needs and costs. While only minor changes to the allotment formula for general drinking water infrastructure improvements resulted from the new needs survey, responses to new survey questions about the material composition of drinking water service lines were used to develop a separate allocation formula to distribute approximately $2.9 billion for lead service line identification and replacement. While the April 4th announcement pertained specifically to $6.5 billion appropriated for the federal fiscal year 2023 (FY23) – including the $2.9 billion for lead service lines - the new allotment formula is expected to be used in future years for DWSRF funds appropriated through 2026.
Under the revised allotment formula for lead service line replacement, some states will get millions more over the next four years, compared to amounts they would have received under the formula used for the first year of IIJA’s lead funding (FY22), which did not take into account any information relating to how many lead service lines a state has reported or is estimated to have (sometimes referred to as a state’s “lead burden”). A few takeaways:
The revised formula brings the allotment of the lead funding in closer alignment with states’ lead burdens, as reported by water systems in those states, compared to the formula used to allot the FY22 lead funding, which did not consider any information relating to the known or estimated presence of lead service lines.
If the water systems did not respond or responded with inaccurate information - as with any data based on sampling - the results come into question. EPA’s response to NRDC’s FOIA request provides a compilation of the responses to questions about service line materials in the 2021 DWISNA survey. Scrutiny of this data will provide insight into how the prevalence of “unreported” or “unknown” responses in some states impacted EPA’s analysis and the resulting allotment of LSLR funds.
The methodology developed by EPA to derive the allotment formula using responses to the recent needs survey points to the continuing need to prioritize robust inventories of lead service lines, and the importance of using updated inventory data to further improve the allotment formula to ensure an even more equitable allocation of federal lead funding in upcoming years.
The degree to which the new allotment formula directs funding where it is needed most is limited by the fact that lead service line inventories were still dramatically incomplete or unknown in 2021 when the most recent drinking water needs survey was administered. Further course corrections will be needed as more accurate and complete lead service line inventories are compiled and reported by water systems, and we believe EPA is considering this. To comply with the Lead and Copper Rule Revisions of 2021, water systems must update their lead service line inventories by October 2024, and states can use federal lead funds distributed over 2022 and 2023 to help water systems update their inventories. We can therefore expect water systems (and states) to significantly improve their inventories between 2021 when the drinking water survey was finalized and the end of 2024 with the federal mandate. Updated lead service line inventories can provide the data needed to further improve the allotment formula over upcoming years.
Florida and other Southern states are projected to have more lead service lines than previously estimated.
EPA’s methodology for projecting the number of lead service lines a state was based on water system responses to the recent needs survey, as described in a later section of this memo. Using this methodology, there is a significant increase in the number of estimated lead service lines in Southern states compared to NRDC’s 2021 estimates (Figure 1). The EPA’s lead service line projections for the South now represent roughly a third of the country’s total. Using the EPA’s methodology, the South exceeds the Midwest in estimated lead service lines, one of the biggest surprises in this new data set.
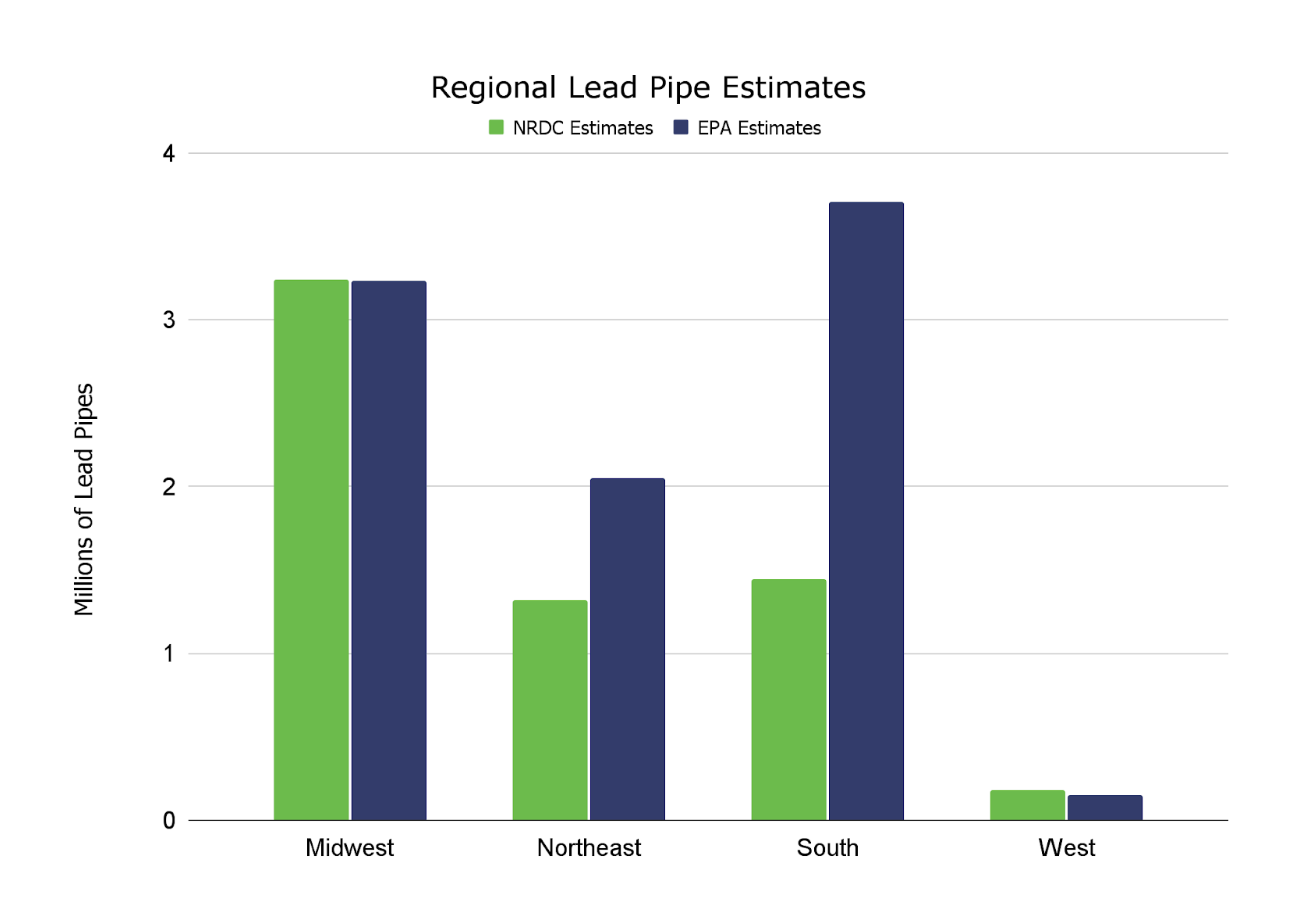
Figure 1: Regional comparison between the NRDC and EPA estimates of lead service lines per state.

Figure 2: Top lead-burdened states based on NRDC and EPA estimates.
The increase in estimated lead service lines in comparison to the NRDC numbers is driven primarily by Florida (1,159,300), Texas (647,640), Tennessee (381,342), and North Carolina (369,715), which EPA’s estimates place in the top 10 lead-burdened states (Figure 2). EPA ranks Florida - a state with some of the newest housing stock in the country, which does not usually correspond to a high number of lead service lines - as the state with the most lead service lines in the country, and Texas is fifth on the new list. Midwestern states such as Illinois (1,043,294) and Ohio (745,061) and others such as New York (494,007) also have higher estimates and remain in the top ten lead-burdened states. Twenty-six states are projected to have more lead service lines than previously estimated, and 24 plus the District of Columbia are projected to have fewer.
Figure 3 compares EPA’s estimate of the number of lead service lines in each state with the amount of lead funding to each state under the new allotment formula. Twenty-nine states with projected lead service lines between 1,454 (Alaska) and 95,144 (Alabama) received $28.65 million in funding. The Safe Drinking Water Act requires that each state receive a minimum allotment of one percent of the total amount available to states, which is in this case $28.65 million per state.

Figure 3: Comparison of the projected number of lead service lines with the new EPA allotments.
The new allotment formula directs more lead funds to states with higher projections of lead service lines. Florida, in particular, stands out - an issue that was highlighted in this recent article. Florida, Illinois, and Ohio more than doubled their federal funding for lead service line replacement, with at least $95 million or more from 2023 funds compared to 2022. Florida and Illinois now have over $230 million each allotted for lead service line replacement. On the other hand, California and Texas experienced a decrease, with reductions of $221 million and $76 million, respectively. The lead funding for Massachusetts, Georgia, Alabama, and Washington will decline by approximately 50 percent.

Figure 4: Changes in funding for some states between FY22 and FY23.
Tracking lead service line replacement rates - and costs - is critical.
Based on the EPA projections and revised allotment formula, EPIC created a series of three maps below as well as an interactive model that demonstrate the impact of changing the allotment formula. (2) EPIC will continue to track the funding for lead service line replacement through our dashboard tracking the intended use of State Revolving Funds through data from state Intended Use Plans (IUPs).
As illustrated by Figure 5, under the previous allotment formula - had it been used over all five years of the lead funding - approximately two-thirds of states would have received enough money to replace at least half of the lead service lines they were estimated to have per the NRDC estimates. This is due to the fact that generous funding was provided to states with relatively low lead burdens under the formula used for FY22 funds. As illustrated by this map, regions like the Great Lakes states had relatively little money to address their large number of lead service lines, because the formula was based on general drinking water needs, not reported or estimated lead service lines.
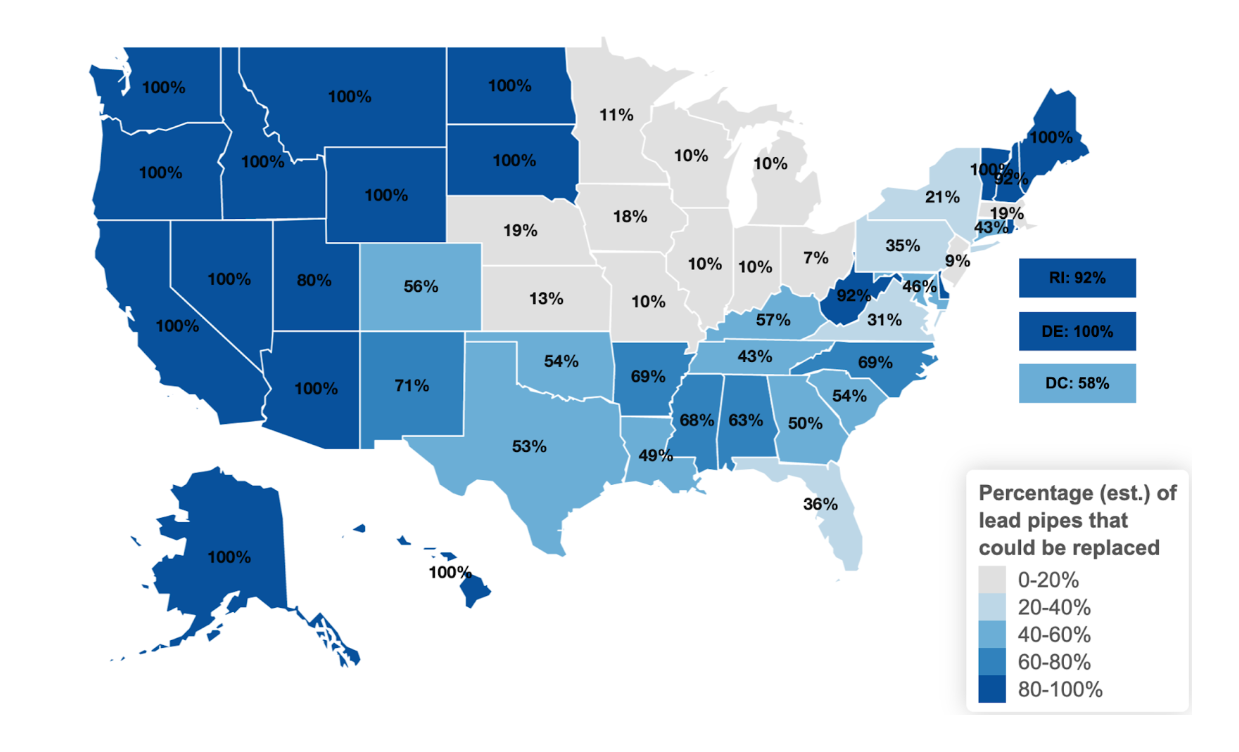
Figure 5: Percentage of lead service lines that can be replaced using FY22 allotment formula and lead service line estimates from NRDC. An average cost of $7,700 per lead service line removal was used for calculating the percentages.
Our new map (Figure 6) shows the impact of the new EPA estimates for lead service lines per state and the revised allotment formula. The map illustrates that, even though most Southern states are capturing more federal funding under the new allotment formula, against the dramatic increases in these states’ estimated lead service line numbers the funding allotted would be able to address only a relatively modest percentage of their estimated lead burdens. Allotments to Western states remain adequate. Although Western states will receive only the minimum required to be allocated to each state - one percent of the total funds available for distribution to states - they also have low estimated lead burdens. (3)
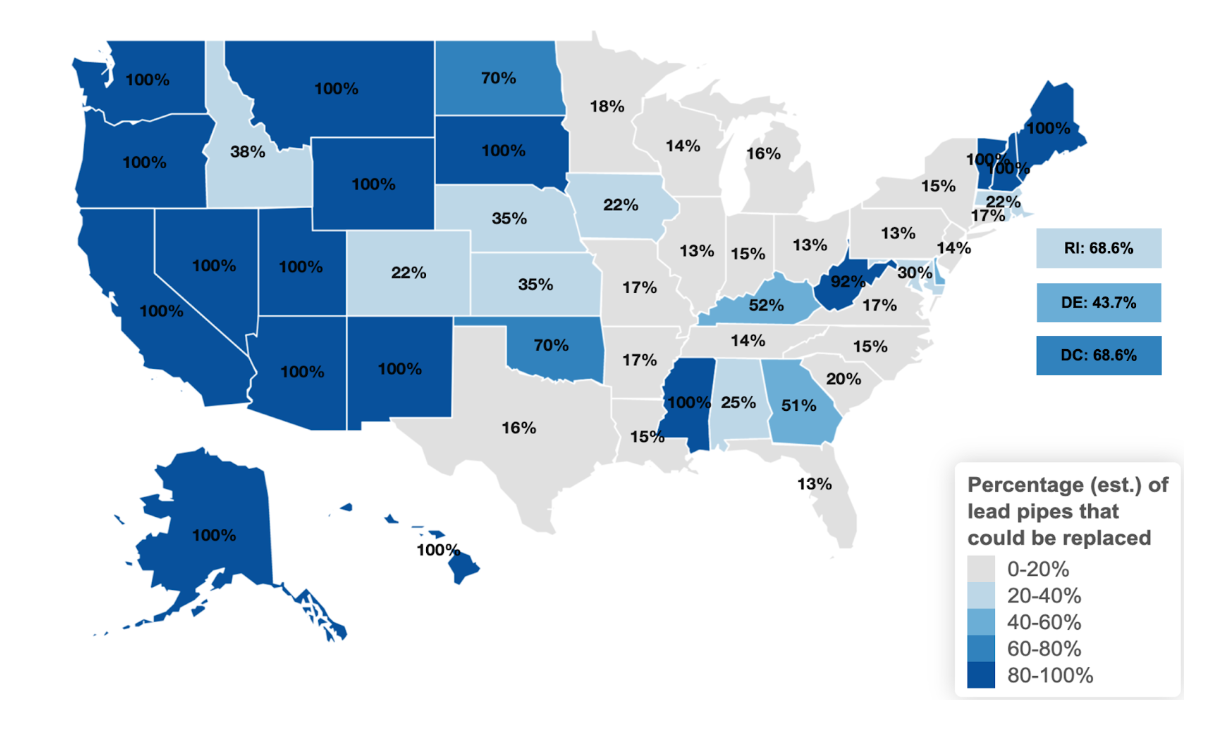
Figure 6: Percentage of lead service lines that can be replaced using federal funding FY23 allotments based on the new EPA methodology for projecting lead service line numbers. An average cost of $7,700 per lead service line replacement was used for calculating the percentages.
Four types of changes are reflected on this map:
Funding has gone up for several states known to have high lead burdens. Lead service line estimates for Wisconsin, Indiana, and New Jersey, for example, remain generally unchanged whether calculated per the NRDC or EPA methodology. This may be because these states already had more complete lead inventories compared to many other states, and so the likely margin of error under the EPA methodology may be narrower. Funding allotments have gone up for these states, however, because the revised allotment formula is now related to the estimated number of lead service lines. The new funding formula brings almost $100 million in new funding per year for these three states.
EPA’s methodology projects a surprising number of lead service lines in some states with relatively underdeveloped inventories. Idaho, Florida, Tennessee, and Louisiana saw the estimated number of lead service lines go up dramatically and their funding increased as well. These are the top four states with biggest changes in lead service line projections under the EPA methodology, compared to NRDC’s estimates: Idaho (797 percent), Florida (580 percent), Tennessee (515 percent), and Louisiana (477 percent).
Funding adequacy unaffected: Western states have relatively low lead burdens. For example, California is not estimated to have a high lead burden under either the EPA methodology or NRDC’s estimate and, even where the state’s allotment under the new formula is dramatically reduced, it still remains adequate relative to the estimated lead burden. Several of these states are receiving the minimum mandatory one percent of the available funds, but because these states have relatively low lead burdens according to estimates, this funding is adequate.
Funding is decreased under the new formula relative to how funds are allocated for general drinking water infrastructure needs. For example, Colorado saw its estimated number of lead service lines almost double, but its allotment dropped by about 40 percent. This is because Colorado would have received more lead funding if it were still allotted per the general drinking water needs formula, rather than the new lead-specific formula. A similar story can be told for Texas.
Figure 7 combines the information illustrated by the prior two maps to show how the shifting lead service line estimates and revised funding formula play out, with a general increase in the perceived adequacy of funding allotments to the Midwest and Great Lakes regions to make progress toward 100 percent lead service line replacement. Importantly, every Great Lakes state will see an increase in lead funding under the new allotment formula, with the exception of Minnesota which sees a 12 percent decrease in funds. The changes in actual funding allocated to states are illustrated in Figure 4.
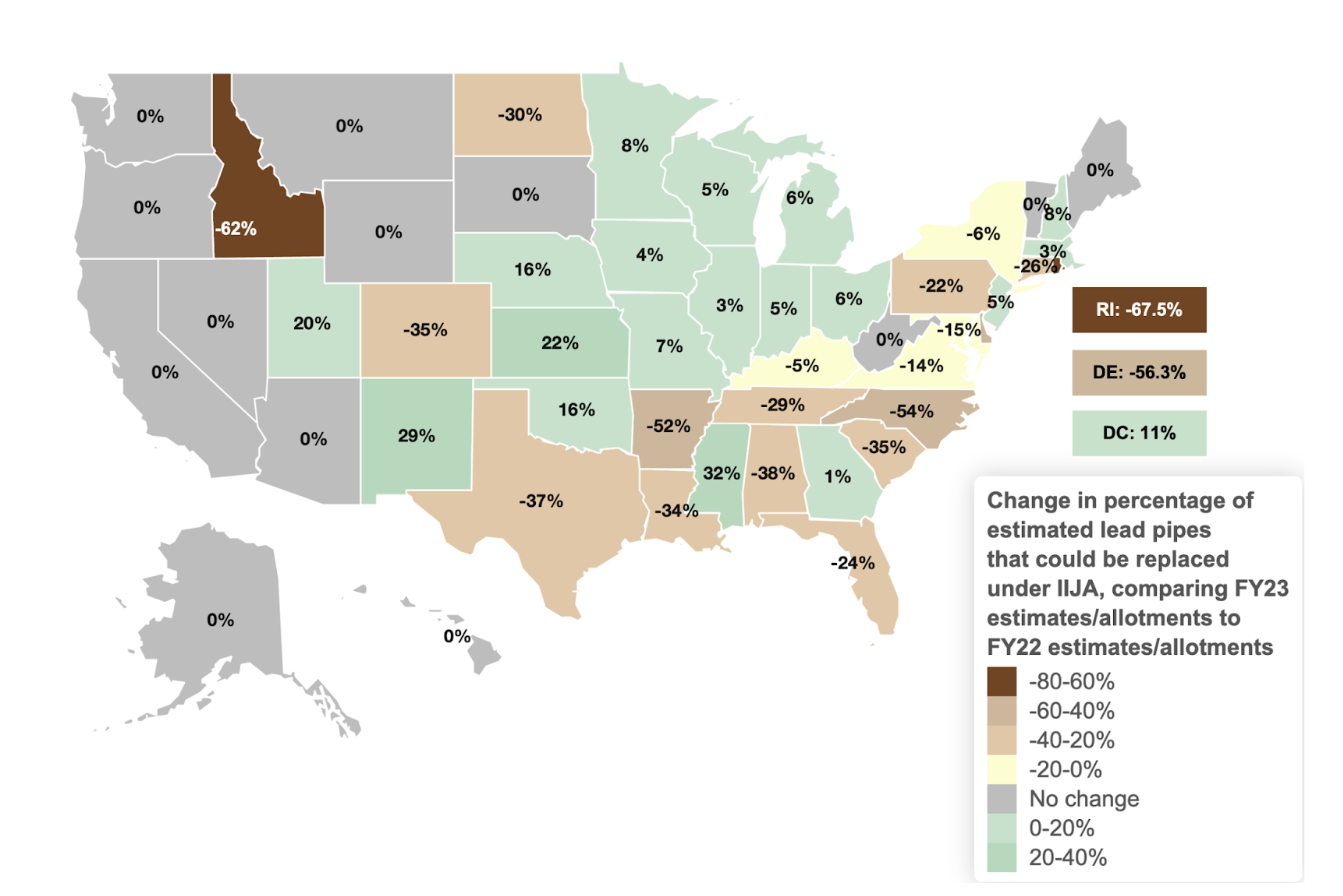
Figure 7: Comparison between FY22 and FY23: changes in the percentage of estimated lead service lines that could be replaced using allotted federal funding.
Looking at Eastern states, though Delaware and Rhode Island are shaded brown in Figure 7, the actual amount of funding allotted to these states will remain stable under the revised allotment formula. Most notably, although Pennsylvania is shaded brown in Figure 7, it will receive nearly $70 million more in lead funds under the new formula, a roughly 78 percent increase in actual funding. New York will see a modest two percent decrease in lead funding under the new allotment formula.
The dramatically increased lead service line estimates for Southern states affect the increase in funding allotments to these states under the revised formula. It is important to note, however, that as illustrated in Figure 4, several Southern states shaded brown in Figure 7 will see substantial increases in the actual amount of lead funding the state can expect to receive under the revised allotment formula: Florida (128 percent increase in funds), Tennessee (82 percent increase), Louisiana (54 percent increase), Arkansas (6 percent increase). North Carolina’s funding remains stable.
The cost per lead service line is still a big variable that needs to be controlled.
Reported per-pipe costs to replace lead service lines vary drastically across the country, from as low as a couple thousand dollars in some parts of the Midwest and South, and up to $25,000-$27,000 in Chicago. In 2019, EPA identified $4,700 as the national average. Based on an inflation calculator, this 2019 EPA average would be $5,531 in 2023 dollars. We use $7,700 in EPIC’s models to recognize the impacts of inflation, workforce availability challenges, federal contracting requirements, and cost variability across the country that point to an actual average cost that is most likely higher than $4,700. While EPIC is using $7,700 as an average, we urge EPA to update their 2019 average cost estimate of $4,700 to align with inflation and other cost considerations in effect across the country.
Regardless of the number used, costs remain a critical variable in how far funding will go. Water utilities have little information on this and thus limited ability to control prices when negotiating contracts. States should do more to provide information to their jurisdictions on contracts and pricing, to help cities and utilities get fair cost estimates.
There is an ongoing need for more data on the location and number of lead service lines.
The most recent needs survey was the first to include questions on service line material since the surveys were first conducted decades ago. Presumably, these questions will continue to be included in future surveys. Water systems in EPA’s survey were asked - in an optional questionnaire - to provide information on the number of service lines (both publicly and privately owned), and information about the service line and connector material. There was a 75 percent response rate to the questionnaire. EPA describes its methodology as follows:
To develop estimated counts of service lines, system level data was extrapolated at the state and national level using similar methodology as for the primary [needs survey]. Responses from the [survey’s] service line questionnaire were used to estimate the numbers of service lines of each material type. Because water systems have not yet completed inventories, we do not know how many of the reported service lines of unknown material are actually lead. Therefore, for each state, EPA applied the ratio of the number of known [lead service lines] to the total service lines of all known material types to project how many service lines of unknown material might be lead. This same projection was done for the standalone galvanized service lines. A state specific ratio was developed to derive the total projected count of [lead service lines] in each state. These state numbers were then totaled to calculate the total national [lead service lines] number. If a state reported all unknown materials or did not respond to the survey for large and medium systems, a national ratio derived from the states for which EPA had data was applied. For small water systems, a national ratio was applied to the number of connections reported in small systems in each state. (4)
Figure 8 illustrates how the EPA’s methodology extrapolates the ratio of reported lead service lines to non-lead service lines onto remaining service lines in the state labeled “unknown” or “unreported” to estimate and compare states’ lead burdens, without considering other factors such as the age of housing stock for “unknown” or “unreported” service lines. For states that reported all service lines as “unknown” or did not reply to the survey, however, EPA instead applies a “national ratio.” Results from the FOIA to EPA with the survey results can be found here.
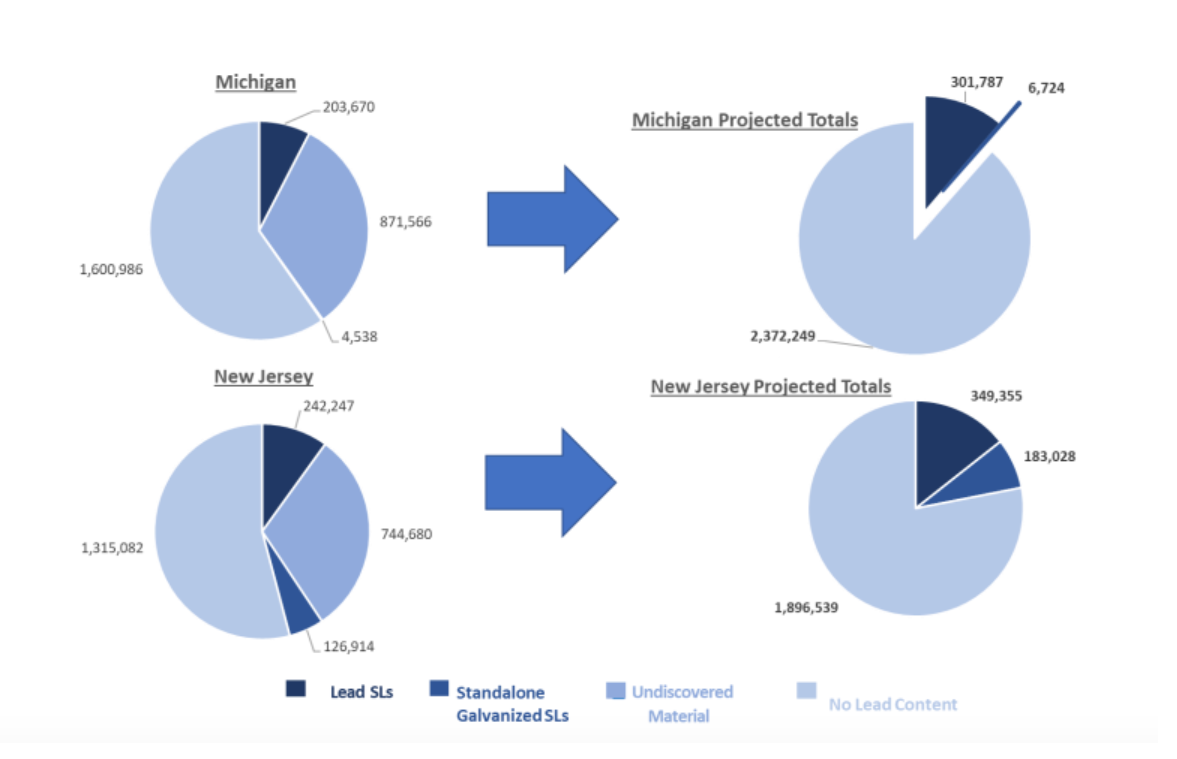
Figure 8: Estimated known service line materials applied to undiscovered. (5)
EPA’s methodology points directly to the importance of water system and state efforts to improve their compilation and reporting of lead service line inventories in order to improve EPA’s estimations of states’ relative lead burdens. Updated lead service line inventories will, in turn, ensure that federal lead funding is allocated across states more equitably, in line with more robust estimates of states’ lead burdens.
There is likely going to be a need to align updated inventory data and federal funding allotments in the coming two years.
Under the normal cycle, the next water infrastructure needs survey is not expected to be administered until late 2025, with results compiled by early 2027 to inform the allotment of FY27 DWSRF appropriations. In the meantime, EPA could explore ways to ensure that updated inventory data compiled by water systems and states prior to 2025 can be used to update the allotment formula for federal lead funding. For example, EPA could request that water systems and states report updated inventory data following the Lead and Copper Rule’s October 2024 deadline as an off-cycle supplement to the most recent needs survey, and expedite the collection and compilation of this data in time to inform a revised allotment formula for the last two years of lead funding from IIJA (FY24 and FY25).
Congress could also take steps to ensure a more equitable distribution of the lead funds. Congress could attach to its next SRF appropriations bill a limited exception to the Safe Drinking Water Act’s requirement that EPA rely solely on data from the drinking water needs survey to determine funding allotments, and allow EPA to collect inventory updates and revise the allotment formula on a rolling basis to allot the remainder of the lead funding from IIJA. Congress could also waive the one percent minimum allotment of SRF appropriations in the case of the lead funds, thus making more of the lead funds available to states with high lead burdens.
In short, though the changes in the allotment formula announced on April 4th are now more aligned with lead burdens, which is a step in the right direction, the stakes to ensure the data is accurate and complete are now much higher.
Footnotes
(1) It may seem odd at first glance that Texas - for which EPA estimated a larger lead burden relative to NRDC’s estimate - also saw a decrease in lead funding under EPA’s new allotment formula. But, remember, the FY22 formula for the allotment of lead funds was not related to states’ estimated lead burden but rather to the assessment of states’ water infrastructure needs more generally. Thus, under the general formula used for FY22 lead funding allocations, larger states like California and Texas received more funds.
(2) EPIC uses $7,700 in this model as an average replacement cost per lead pipe. We want users of these maps and our online model to understand that, by using this estimate, we are introducing a variable that may differ significantly from state to state, and changing the number will result in a different estimate of how many lead service lines can be replaced with IIJA funding.
(3) EPA’s estimate for Idaho was eight times the NRDC estimate. This could be accurate but might also be an artifact of the methodology EPA used to estimate lead service lines in rural areas and places with lower reporting rates.
(4) EPA.7th Drinking Water Infrastructure Needs Survey and Assessment April 2023, FAQ,. p.2. https://www.epa.gov/system/files/documents/2023-04/Final_FAQ_DWINSA_4.4.23.v1.pdf
(5) EPA.7th Drinking Water Infrastructure Needs Survey and Assessment April 2023, Fact Sheet, p.7. https://www.epa.gov/system/files/documents/2023-04/Final_FAQ_DWINSA_4.4.23.v1.pdf