Digging into Lead Service Line Mapping and Inventories
By Maureen Cunningham and Olya Egorov
In the United States, there are an estimated 6-10 million lead service lines in approximately 11,000 communities that deliver drinking water to our kitchen taps, potentially exposing individuals of all ages to lead poisoning. Although a number of cities have committed to removing lead pipes in their communities, several municipalities lag behind, largely due to disparities in access to funding, as well as their capacity to manage a wide range of water quality issues in addition to lead.
If the revised Lead and Copper Rule (currently subject to a regulatory freeze, while the EPA seeks additional public input) goes into effect, one of the biggest revisions affecting public water systems is the requirement that all water systems conduct an inventory of lead service lines, both public (owned by the water system) and private (owned by the homeowner or landlord) or otherwise prove the absence of lead service lines.
Aside from the pending federal regulations and some existing state-level regulations, identifying, mapping, and conducting inventories of lead service lines is one of the first steps to launching a successful lead service line replacement program. The location and number of lead lines, for example, can help determine the most adequate funding strategy, including which grants or loans the municipality can apply for and the percentage of lead lines on the private side versus the public side of the line. Knowing the number and location of lead lines is a basic first step to addressing the problem.
So, how is a lead service line inventory conducted?
The first step, according to the Lead Service Line Replacement Collaborative, is to find existing data. This includes, but is not limited to, looking at the years homes were built and finding any historical documentation of the buildings in a given community. While lead service lines were banned for use at a federal level in 1986 through amendments to the Safe Drinking Water Act (SDWA), several states - but not all - passed legislation prior to that banning their use in new housing. Knowing when a house was built and hooked up to the water system is an important factor in understanding the likelihood of lead service lines being present.
Utilities have different strategies for identifying lead service lines, from identifying them when they are replacing water meters, or when they happen to be in the street doing other work. These may be effective strategies for smaller municipalities with a handful of pipes, but they are not as feasible for larger municipalities with thousands of lead service lines.
Similar to other spatial analyses and planning done at the municipal level, geographic information systems (GIS) have been utilized to create lead service line inventory maps. Predictive modeling is another effective mapping tool implemented through the use of machine learning. The group Blue Conduit became a pioneer for predictive modeling, and utilized predictive maps in places like Flint, Michigan to help identify lead pipes at an expedited pace by cross-referencing state laws and the dates homes were built to decipher which homes likely have lead pipes.
In addition to the resources and staff to create the inventories, there is also the need to maintain and update the inventories as lead lines are replaced. While large municipalities like Washington, DC have the means to dedicate staff resources to update maps, several small and disadvantaged municipalities do not. While some organizations such as Blue Conduit and the Center for Geospatial Solutions are working to create GIS maps for municipalities that do not require GIS expertise, there are currently no lead service line mapping templates available for widespread municipal or utility use.
The public can play a significant role in the process of conducting inventories of lead service lines as well. Public awareness can increase pressure on state officials to implement a program and also can help encourage residents to engage in the mapping and inventory process by reporting the status of unknown pipes in their homes, since lead service lines can sometimes be identified from inside a home.
Example of lead service line maps and inventories
As an inventory is developed, it is important for the municipality to keep track of the locations of the lead service lines through a map of all known and unknown service lines. Although not all cities have online maps, access to such maps is an especially useful tool for city residents, planners, community advocates, and policymakers. We looked at a few examples of online lead inventories to see what worked, what didn’t work, and generally, what could be done better at the city level.
DC Water:
DC Water in Washington, DC is a model example of both an effective inventory process and lead service line identification map. After conducting an initial record, DC Water created a GIS map of all known and unknown lead pipes, marking both the private and public side of each map. The map was made publicly available to receive input from residents on homes with unknown pipe material. The map is also color-coded to indicate whether partial lead service line replacement was done, on either the public or private side.
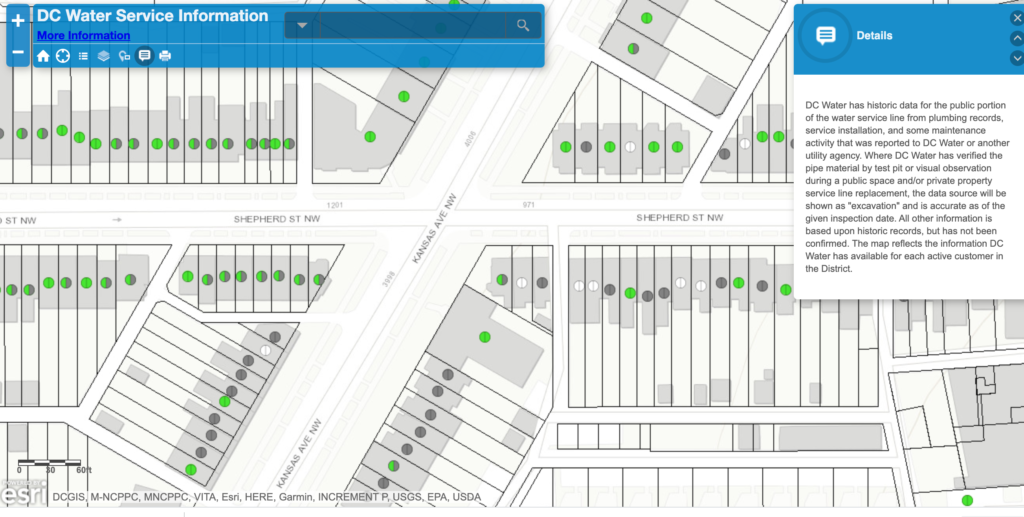 Screenshot of DC Water's online lead service line map.
Pittsburgh Water and Sewer Authority (PSWA):
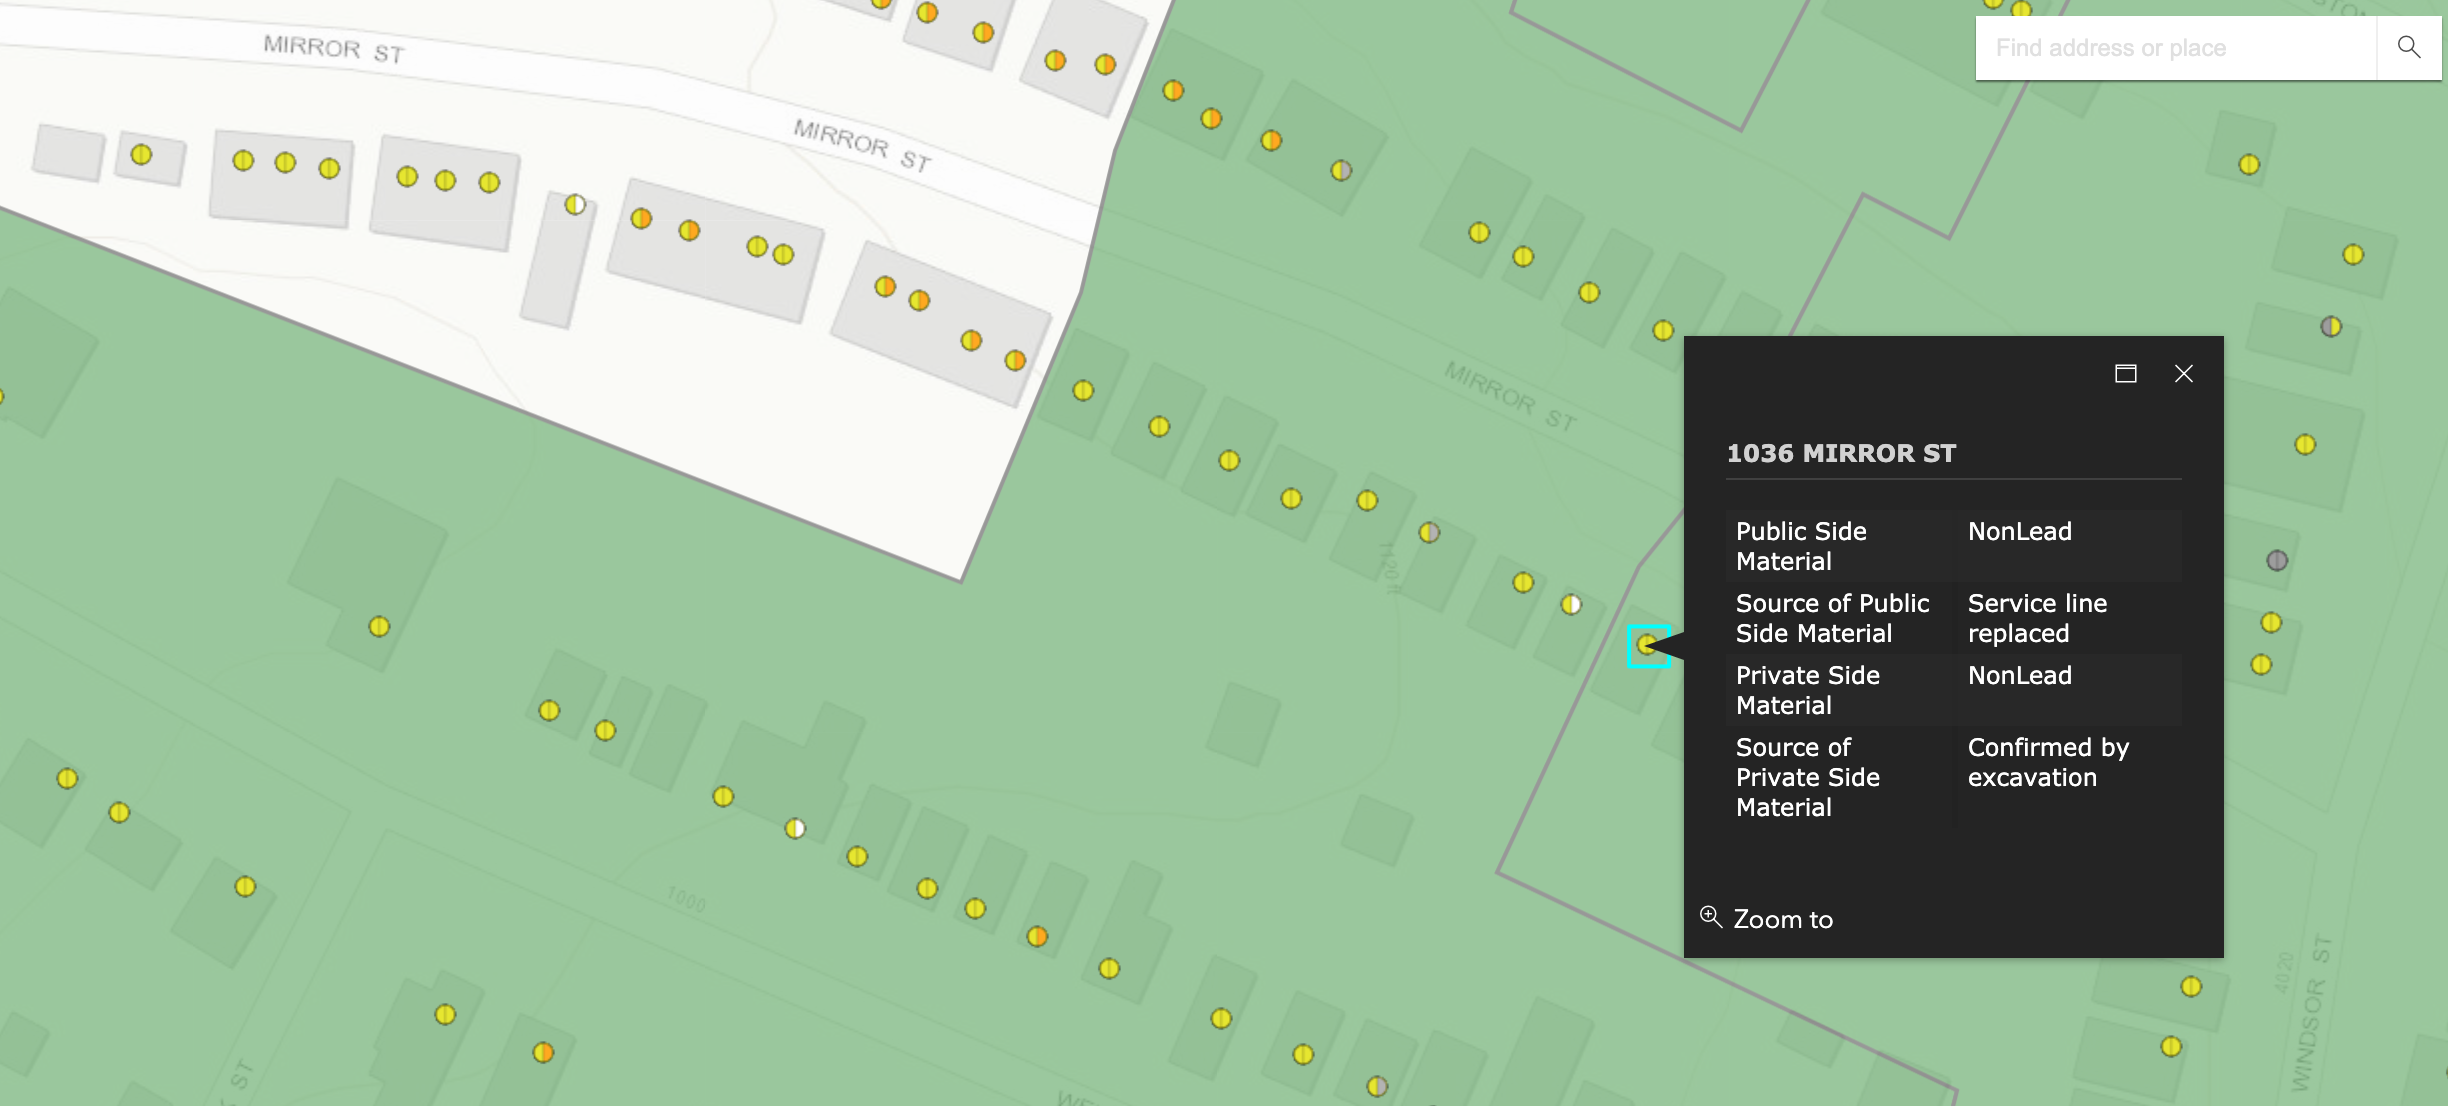 Screenshot of PSWA's online lead service line map.
Like DC, Pittsburgh is often cited as having a model online map and inventory of lead service lines. The information on their map comes from a combination of historical property data, construction records, and results from curb box inspections. Like DC, they too highlight the pipe type on the public and the private side, including pipes of unknown material. A larger version of this map shows where in the city the water authority has completed lead service line replacements, where it is working now, and future zones where it will be working. PSWA worked with a consultant to create its map, a process which is highlighted in a video on their website.
Boston Water and Sewer Commission:
Boston Water and Sewer Commission also has an online inventory map. While the map demonstrates where lead lines are located in residential homes, the map does not indicate whether the lead line resides on the public or private side of the curb stop, unless the red tab is clicked. Additionally, the city does not indicate where material is unknown, unlike DC Water and PSWA.
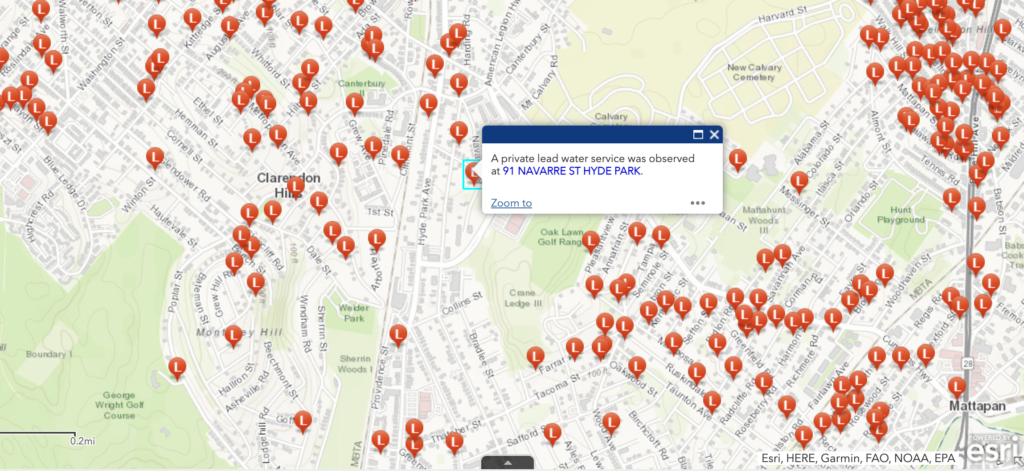 Screenshot of Boston's online lead service line map.
New York City Department of Environmental Protection:
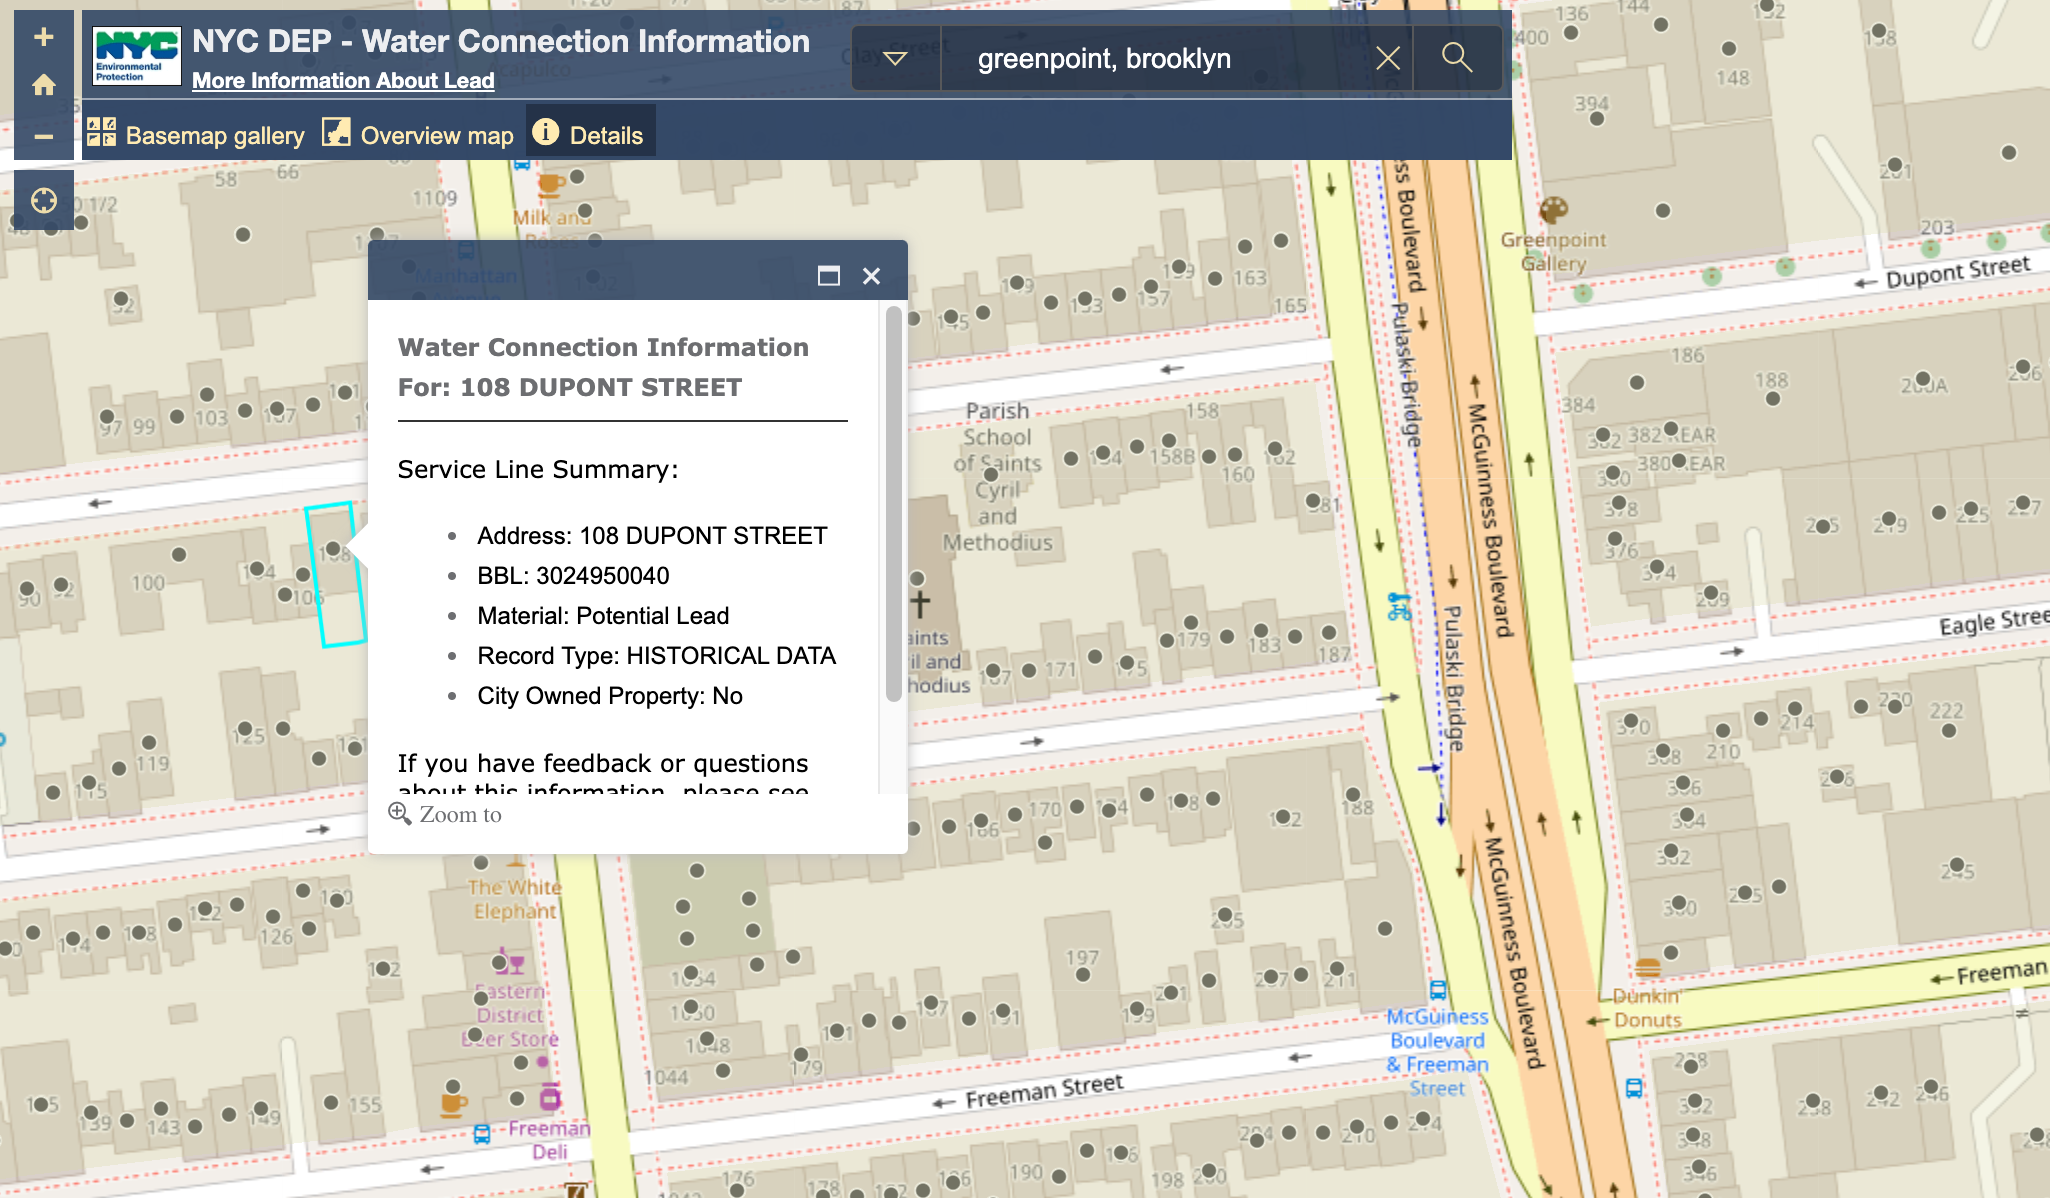 Screenshot of NYC's online lead service line map.
New York City, which has thousands of lead service lines, also has an online map that is based on historical records supplemented with information collected by city agencies. While the map is searchable by address, all data points are colored in black, whether or not they are lead pipes, not lead, or unknown - making it hard for decisionmakers to get a bigger picture of the extent of the problem and understand which neighborhoods in the city have the biggest hotspots without clicking on individual dots. The map also does not distinguish between public and private side service lines. State legislators have asked New York City to change this to a color-coded map, as yet to no avail.
Other uses of lead service line data and maps
The example of New York City demonstrates the difficulty for community advocates in communicating risk to residents with pipes of unknown materials without doing a click-by-click analysis of their neighborhood.
A map developed by the New York City Independent Budget Office (also shown below) is perhaps a better tool for community advocates and policymakers to understand the big picture of lead contamination in drinking water, though this does not replace the need for a more user-friendly lead service line inventory for utilities and residents.
These kinds of big picture maps, including one from New Jersey showing the entire state, are useful for policymakers and advocates to understand the extent of the problem and free up the necessary funding to address it.
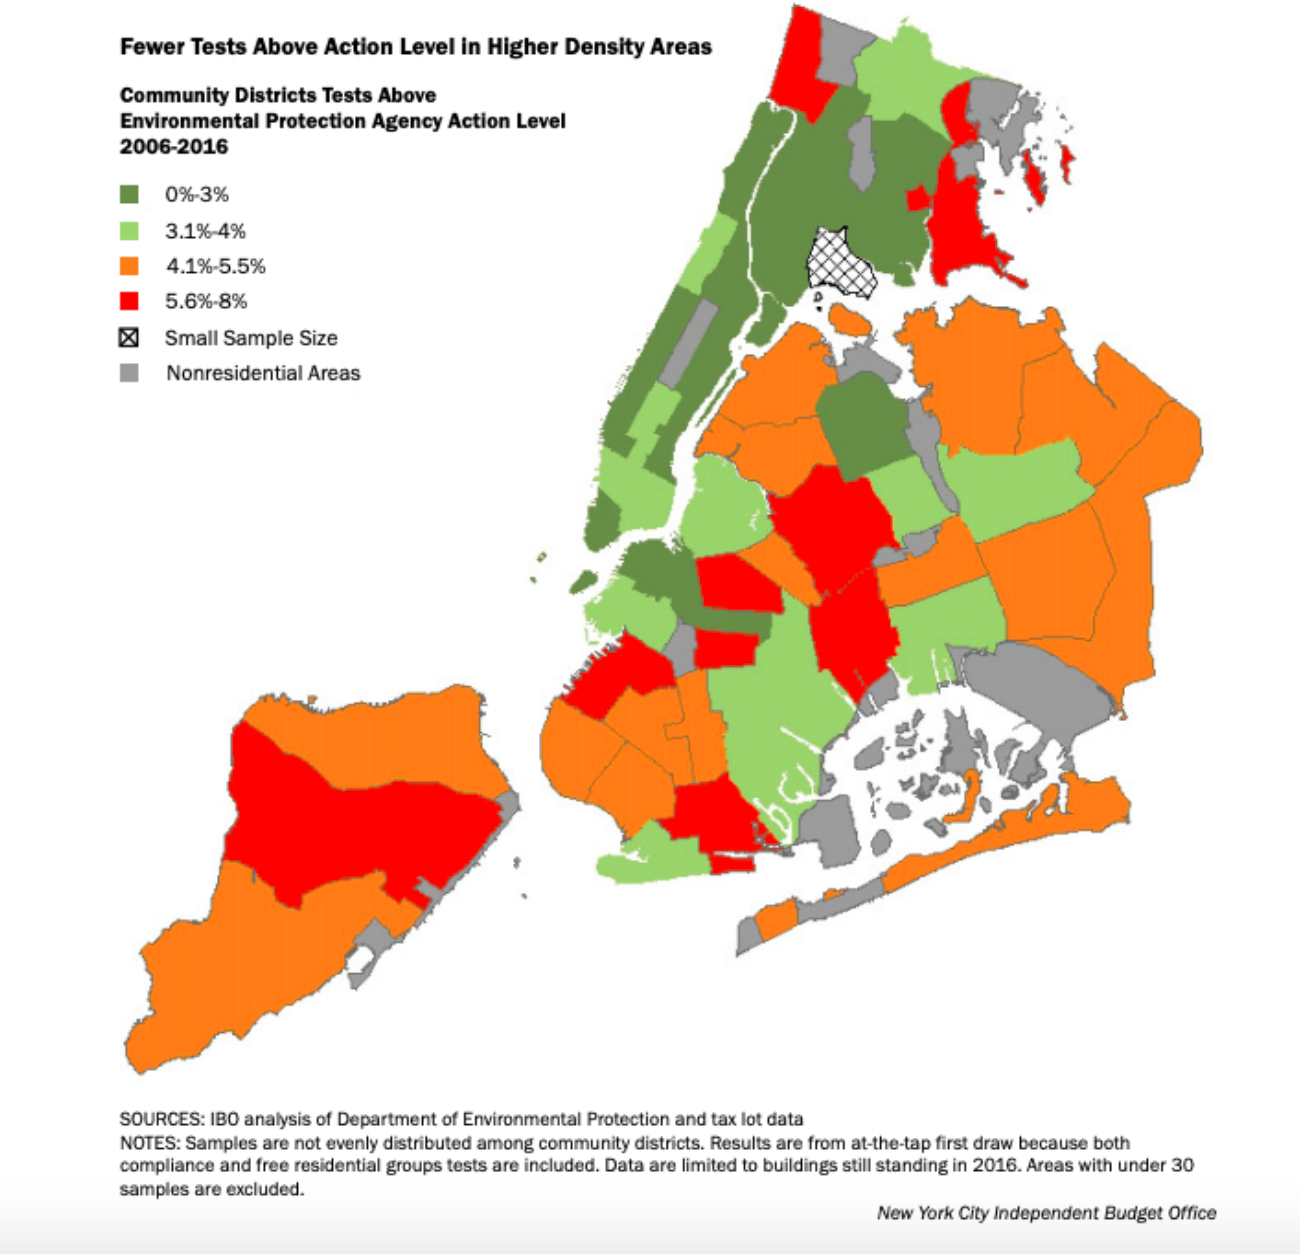 Lead service line risk in NYC (Source: NYC Independent Budget Office, 2018)
In summary, though there are several examples of lead service line maps and inventories around the country, they are not all the same, with the “best ones” being color-coded, publicly accessible online maps with information on the kind of pipe material (including unknown material), differentiation between private and public side materials, and updates on the replacement process itself.
The bigger issue ahead, however, is that there are many more municipalities who have not yet begun this process. We spoke with the utility representative in a New England city of over 40,000 people, who kept all information on lead pipes in an Excel spreadsheet rather than in any kind of mapping system. With the impending revisions to EPA regulations, mapping and inventorying lead service lines will not be something municipalities do on an ad hoc basis, but instead, will become a required feature of their water management portfolio.
While the task ahead in creating an inventory for the upwards of ten million lead service lines across the country seems large, there is cause for hope. With the federal funding from the Biden administration’s American Rescue Plan and the proposed American Jobs Plan, there are strong prospects that funding and resources will become increasingly available to municipalities across the country - even those who have not had the resources to date - to start the process of identifying, mapping, inventorying, and ultimately, replacing these toxic lead pipes.

